
Editor’s Note: Today’s article is a little different.
What you’re about to read is typically reserved for paid subscribers to Dividends & Income Select — the premium service where Dave Van Knapp shares the real-world details behind his long-running Dividend Growth Portfolio.
But Dave wanted to make this portfolio update available to Daily Trade Alert readers today, because it’s a perfect “behind-the-scenes” look at how dividend-growth investing actually works when you stick with it for years.
If you’d like to follow along with Dave’s portfolio — and see what he’s buying next — you can get full access here.
2025 Review Of Dividend Growth Portfolio –Dividends Up 17.2%, Yield On Cost Reaches 18.7%
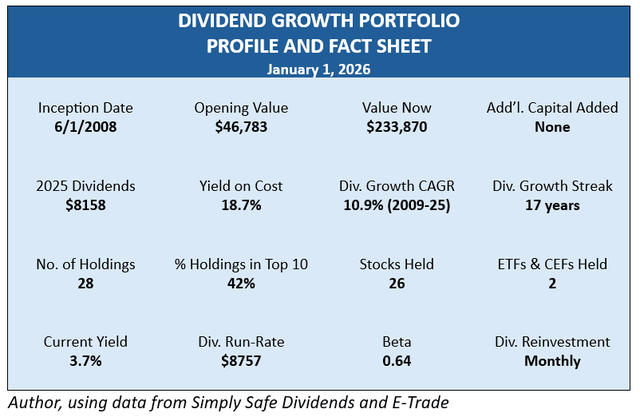
Here is a profile of my Dividend Growth Portfolio as we begin 2026.
The portfolio’s main objective is to grow the dividend stream essentially all the time, rarely taking a step backwards. A secondary objective is to deliver satisfactory total returns.
In Morningstar’s Style Box, this would be classified as a Large Value portfolio. Most of its holdings are in that segment, while a few are designated as Mid Value or Mid Core.
2025 Highlights
The DGP wrapped up 2025 with new highs dividends received for the year and forward yield on cost. It also tacked on a good increase in total value.
Highlights for 2025 (details come later):
- Dividends collected grew 17.2% to $8158. This is a new annual record high.
- Yield on cost grew to 18.7%. That isalso a new record high.
- Annual dividend run-rate grew 15.3%. Dividends are now flowing in 15.3% faster than a year ago. The run-rate is also at a record high.
- Total dividends received from the portfolio have nearly reached 1½ times the original cost of the portfolio.
In the following sections, let’s review the general business model, and then the reasons behind the highlights.
How Dividend-Growth Investing Works
Dividend-growth investing is a niche strategy with innumerable variations in tactics and execution. DGI lies in the Income & Growth and/or Blend categories of the following diagram.
Author
In DGI, growing income comes from stocks, and capital growth comes largely from the fact that most of the positions are in equities rather than bonds or other fixed-income assets.
The Dividend Growth Portfolio is operated according to my Business Plan.
My primary goal is to build a reliable, steadily increasing stream of dividends over many years that can eventually be used as income for retirement.
Obviously, this goal is more about producing cash flow returns than capital gains. I try to create an optimal income stream, which is not necessarily the largest possible. I willingly forego some potential dollars in income and total return in favor of dividend growth, safety, reliability, and lower price volatility.
The next diagram shows how DGI grows the income stream. It operates like a machine with four gears.
- Dividend increases. Companies raise their dividends directly, by corporate action. You have no control over dividend increases, and the market plays no role either.
- Dividend reinvestments. These are entirely up to you. You control whether and when to reinvest the dividends, as well as what stocks or funds to put the money into.
- Portfolio adjustments. Again, these are entirely up to you. For example, you may decide to sell or trim a holding and move the money into something else. You have total control over whether and where to invest the money from trims and sales.
- Compounding. Compounding is a mathematical marvel. It accelerates your dividend growth rate constantly. You do not “do it” directly, but the other gears, plus the passage of time, set compounding in motion and keep it going.
Compounding means making money on money already earned. In brief, the dividends earned from your portfolio generate ever-growing additional earnings over time. This creates a snowball effect, where your portfolio’s income stream grows faster and faster as time goes on.
2025’s Dividends Grew 17.2% Over 2024’s Total
Here is the dividend growth in the DGP over the last five years.
In 2025, I collected $8158, which was 17.2% more than 2024. In dollars, the increase was $1197.
The percentage and dollar increases were more than I expected last January. The reason they came in higher than normal is mostly attributable to a few trades I made that increased the dividend stream, combined with good results from dividend increases and monthly dividend reinvestments. I will show those numbers later.
Over the long term, the annual growth variations blend into a consistent growth story, as illustrated by my favorite chart about the DGP.
This is my favorite chart, because it illustrates so well how dividend-growth investing works.
- Every year’s dividend total is larger than the year before.
- The CAGR (compound annual growth rate) of annual increases has been 10.9% per year. (Note that 2008 was a partial year, so I leave it out of the CAGR calculation.)
The DGP has never experienced an annual dividend cut. Its annual increase streak stands at 17 consecutive years.
I have this portfolio loaded into Simply Safe Dividends, and it provides the following interesting insight.
This illustrates how the organic dividend growth rates have slowed for the stocks in my portfolio. “Organic” here means raises that the companies declare, not the other gears in the business model.
Let me point out that the computation is not exactly correct, as it is based on current holdings, some of which have shifted as I reinvested dividends and occasionally trimmed and replaced a few stocks. Nevertheless, the numbers are directionally correct in showing an overall slowdown in the average percentage increase of the stocks in the portfolio over the past decade.
You may be wondering how, if the portfolio’s organic DGR has been in the 5-6% range, its portfolio-wide DGR could be 10.9%, as depicted in the prior chart. The reason is that dividend increases are only one gear in the DG machine. The other gears – dividend reinvestments, portfolio adjustments, and compounding – have more than made up for the slowdown in dividend increases.
Yield on Cost Hit Record 18.7%
YOC means the current yield of the portfolio based on its original cost (not its current value). It is directly correlated to the dividend dollars being produced by the portfolio.
Yield on cost looks forward, projecting income the portfolio is slated to produce over the next 12 months, expressed as a percentage of the original amount invested. The YOC formula is easy.
Yield on Cost = Dividend Run-rate ÷ Original Amount Invested
$8757 ÷ $46,783 = 18.7%
The run-rate is the current rate at which the portfolio generates dividends, based on the most recent information about dividends from the companies and funds in the portfolio.
Yield on cost is significant: It shows that the portfolio is sending me cash dividends at a rate of 18.7% per year of my original investment. That is the kind of income performance that was the original inspiration for the portfolio.
There was certainly no guarantee at the beginning that a reliable income return like that would ever be achieved. In all honesty, I still find it a bit miraculous that dividend-growth investing works as well as it does.
Annual Dividend Run-Rate Grew 15.3%
The dividend run-rate — the speed of dividends flowing right now — is different from dividends collected, which is the historical record of dividends already received. I track both.
The run-rate looks forward. It is a conservative 12-month projection of income. It is conservative because it assumes that nothing will change in the coming year. But the fact is that dividends will be raised, additional dividends will be generated through reinvestments, and so on. That is, the other gears in the machine will continue to turn.
At the beginning of a year, the run-rate is only a crude approximation of how the year will turn out, as we do not know yet how much the dividend-growth machine will add to the dividend stream.
At the beginning of 2025, the DGP’s run-rate was $7592. By the end of the year, $8158 had been collected. That is $566 (7.5%) more than had been projected.
The current run-rate is $8757, which is 15.3% more than it was a year ago. That large a leap is unusual for this portfolio, and it is the result of how all the gears worked during the year. Again, that $8757 is a conservative estimate of the collections that will be made during 2026.
Total Dividends Far Exceed the Portfolio’s Original Cost
Over its lifetime, the DGP has sent me almost 1½ times the cash that I spent to start the portfolio in 2008.
Author
The bars on the graph show how dividends add up over time to first duplicate, and then surpass, the original investment.
- The bar on the left shows the original amount invested ($46,783).
- The bar in the middle is a year-by-year stack of annual dividends. It covers 2008-22, at which time the cumulative dividends surpassed the original investment. During that time (14.6 years), I received $48,178 in dividends.
- The bar on the right covers 2023-25. In just those three additional years, I’ve received another $21,526, which is 46% of the original amount. In the first decade of the portfolio, it took more than nine years to collect that much.
This chart also illustrates the year-to-year acceleration of the dividend stream’s growth, meaning that as the years go on, dividends received go up faster and faster.
That is illustrated by the layers in the bars. Each layer = one year of dividends. If you look closely, each layer in the middle and right-hand bars is taller than the layer directly below it, because it represents more dollars than the year before.
The colors in the third bar cycle back through the colors in the middle bar. The first three layers of the middle bar (2008-10) are barely distinguishable from one another at the bottom. But the layers in the third bar (2023-25) are much taller and easy to tell apart.
In brief, total dividends received are not only growing, but their annual growth rate is accelerating. It will take less than six years (2023-28) to duplicate the original amount again. That’s less than half the timerequired in the earlier years of the portfolio.
Dividend Increases, Reinvestments and Portfolio Changes in 2025
This section covers Gears 1-3 of the DG machine.
The first table shows how dividend increases (by themselves) helped the DGP’s dividend run-rate to increase over the past five years.
As you can see, the annual dollar amounts added to the income stream from increases have grown each year. That is because each year’s percentage gain, even in years it went down, has been applied to a larger base amount.
The next table shows the outcome of my dividend reinvestments.
I reinvest dividends monthly into stocks that I select. (I do not drip the dividends.) As you can see, the dollar impact on the total dividend stream has grown each year, mainly because I have more dividend dollars to reinvest each month. Again, the dividends added through reinvestment go up each year.
The next table summarizes the impact of trimming, dropping, and adding new stocks.
In 2025, adjusting the portfolio here and there had a pretty large impact on increasing the dividend stream. This year’s turnover rate was about 12%, which is at the high end for this portfolio.
Compounding
All of the activities discussed above contribute to compounding: Making money on money already earned.
Every gear – whether passive like dividend increases, or active like reinvesting dividends – increases the base rate of dividends being collected. So when the next action comes along that adds even a small percentage to the stream, that percentage is applied to a larger base than in previous months and years.
The result is the acceleration visible in the rate of growth. If the same money had been invested in bonds, the run-rate would not grow, let alone accelerate.
Here is the five-year record of the dividend run-rate for my portfolio. This shows how the run-rate has increased year-to-year over the past five years.
I do not spend much time worrying about how much in dividends I will collect. I report the run-rate, because at any given time, it is the best forward projection we have without speculating about future activities. I could take guesses at future events that will raise the rate, but I rarely bother. I know that the current run-rate will almost always understate the actual dividends that the DGP will collect in the following 12 months.
Total Performance in 2025
I mentioned at the beginning that the DGP has two objectives. The first and primary objective is to generate growing income, as we have been discussing.
The secondary goal is to deliver total returns that are competitive with the general stock market as measured by the S&P 500 with dividends reinvested.
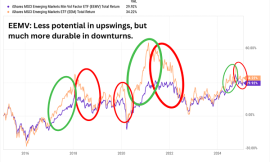
I have long used the SPDR S&P 500 ETF Trust (SPY) for the comparison. But starting now, I am also going to use the total returns of the three largest dividend-growth ETFs that have existed long enough for comparison. Unfortunately, that leaves out Schwab’s U.S. Dividend Equity ETF (SCHD), because it kicked off in 2011.
The total returns of all four funds are calculated with dividends reinvested, because I reinvest my DGP’s dividends back into itself.
Here are the fund results through 2025, starting from the beginning date of my portfolio in 2008.
The total return of the DGP over the same time has been 500.0%. That is more than any of the dividend ETFs, but less than SPY.
I am more than satisfied with that result. As I said earlier, total return is a secondary goal of this portfolio, and I am willing to give up some total return in order to achieve other goals.
Author, using data from E-Trade
Trailing the broad market does not mean that the DGP has not produced attractive total returns. As you can see in the chart, the CAGR through the end of 2025 is 9.57% per year.
In the year just passed, my portfolio’s total return was 14.2%. The others were as shown here:
The story of S&P 500’s returns – which has been driven for the past three years by the dominance of SPY’s Top 10 stocks – may rotate back again in 2026, or SPY’s big run may continue. There is no way to know.
The long-term record of the DGP – 9.57% annual return – is satisfactory to me. Partly that is because the DGP’s return, while less than “the market,” has been really good, and partly because of the psychological benefits that I get from the DGP’s reliable and continually-rising dividend stream.
In terms of dividend income, of course, there is no contest between DGP and SPY. The DGP’s yield is usually two-three times as much as SPY’s. Right now, the DGP’s current yield is 3.7%, compared to SPY’s yield of 1.1%.
To all my fellow investors: Have a happy, healthy, and prosperous 2026!
Thanks for reading!
–Dave
P.S. What you read today is just a small sample of what I share in Dividends & Income Select. If you want the complete picture—including my full holdings and the monthly dividend-reinvestment purchases I make—you can join here.