

American Eagle Outfitters (NYSE: AEO) is scheduled to release its fiscal first-quarter earnings on Thursday, May 29, 2025, with analysts projecting an earnings loss of 22 cents per share on $1.09 billion in revenue. This compares to the prior year’s figures of 34 cents per share and $1.14 billion in revenue. Historically, AEO stock has declined 60% of the time following earnings announcements, with a median one-day drop of 5.4% and a maximum observed decline of 14%.
For the full year, AEO is expecting sales to decline by low single-digits. The company has $2.0 Bil in current market capitalization. Revenue over the last twelve months was $5.3 Bil, and it was operationally profitable with $445 Mil in operating profits and net income of $329 Mil. Also see Buy or Sell American Eagle Outfitters’ Stock?
For event-driven traders, historical patterns may offer an edge, whether by positioning ahead of earnings or reacting to post-release moves. That said, if you seek upside with lower volatility than from individual stocks, the Trefis High Quality portfolio presents an alternative, having outperformed the S&P 500 and generated returns exceeding 91% since its inception. See earnings reaction history of all stocks.

Image by Pexels from Pixabay
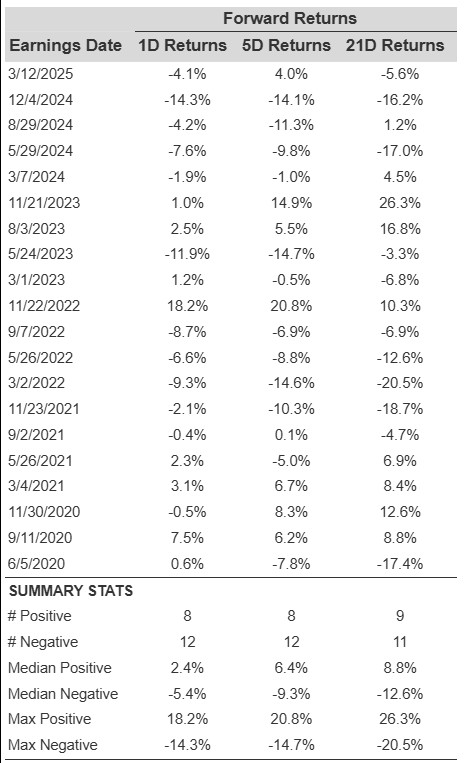
American Eagle’s Historical Odds Of Positive Post-Earnings Return
Some observations on one-day (1D) post-earnings returns:
- There are 20 earnings data points recorded over the last five years, with 8 positive and 12 negative one-day (1D) returns observed. In summary, positive 1D returns were seen about 40% of the time.
- However, this percentage decreases to 36% if we consider data for the last 3 years instead of 5.
- Median of the 8 positive returns = 2.4%, and median of the 12 negative returns = -5.4%
Additional data for observed 5-Day (5D), and 21-Day (21D) returns post earnings are summarized along with the statistics in the table below.
Correlation Between 1D, 5D, and 21D Historical Returns
A relatively less risky strategy (though not useful if the correlation is low) is to understand the correlation between short-term and medium-term returns post earnings, find a pair that has the highest correlation, and execute the appropriate trade. For example, if 1D and 5D show the highest correlation, a trader can position themselves “long” for the next 5 days if 1D post-earnings return is positive. Here is some correlation data based on 5-year and 3-year (more recent) history. Note that the correlation 1D_5D refers to the correlation between 1D post-earnings returns and subsequent 5D returns.
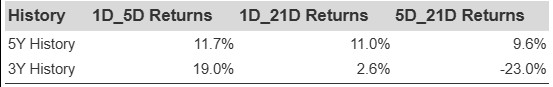
AEO Correlation Between 1D, 5D and 21D Historical Returns
Learn more about Trefis RV strategy that has outperformed its all-cap stocks benchmark (combination of all 3, the S&P 500, S&P mid-cap, and Russell 2000), to produce strong returns for investors.
Invest with Trefis Market-Beating Portfolios
See all Trefis Price Estimates
The views and opinions expressed herein are the views and opinions of the author and do not necessarily reflect those of Nasdaq, Inc.


