

Bath & Body Works stock (NYSE: BBWI) is scheduled to release its fiscal first-quarter earnings on Thursday, May 29, 2025, with analysts projecting earnings of 47 cents per share on $1.42 billion in revenue. This would represent a 21% year-over-year increase in earnings and a 3% growth in sales compared to the prior year’s figures of 39 cents per share and $1.38 billion in revenue. Historically, BBWI stock has increased 60% of the time following earnings announcements, with a median one-day rise of 4.8% and a maximum observed increase of 25%.
In Q4 2024, the company reported a 4% decline in net sales and an 18% drop in earnings per diluted share, citing a shifted fiscal calendar and weakening consumer demand. Looking ahead, BBWI faces mounting pressure from U.S. tariffs on Chinese imports, alongside soft discretionary spending and growing competition from lower-cost private-label alternatives. Persistently high interest rates and economic uncertainty continue to erode consumer appetite for non-essential products like fragrances and candles. For 2025, the company’s guidance of 1-3% sales growth and an EPS range of $3.25-$3.60 reflects a stance of cautious optimism, with the midpoint indicating modest growth compared to the adjusted results of 2024. The company has $6.5 Bil in current market capitalization. Revenue over the last twelve months was $7.3 Bil, and it was operationally profitable with $1.3 Bil in operating profits and net income of $798 Mil.
For event-driven traders, historical patterns may offer an edge, whether by positioning ahead of earnings or reacting to post-release moves. That said, if you seek upside with lower volatility than from individual stocks, the Trefis High Quality portfolio presents an alternative, having outperformed the S&P 500 and generated returns exceeding 91% since its inception. See earnings reaction history of all stocks.

Photo by AdoreBeautyNZ on Pixabay
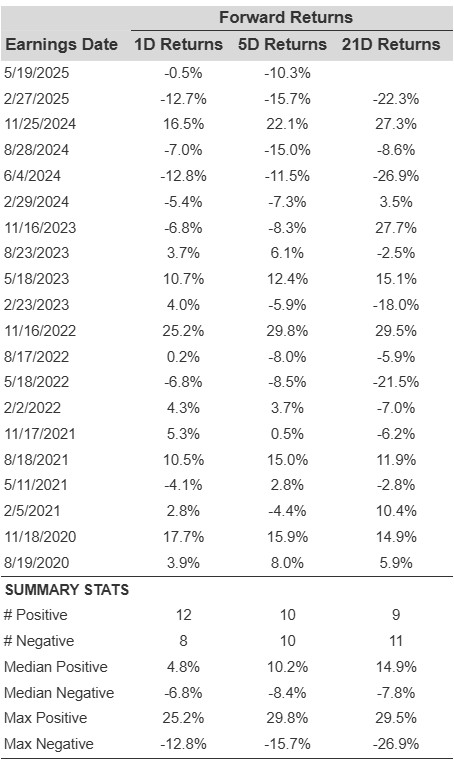
BBWI’s Historical Odds Of Positive Post-Earnings Return
Some observations on one-day (1D) post-earnings returns:
- There are 20 earnings data points recorded over the last five years, with 12 positive and 8 negative one-day (1D) returns observed. In summary, positive 1D returns were seen about 60% of the time.
- However, this percentage decreases to 50% if we consider data for the last 3 years instead of 5.
- Median of the 12 positive returns = 4.8%, and median of the 8 negative returns = -6.8%
Additional data for observed 5-Day (5D), and 21-Day (21D) returns post earnings are summarized along with the statistics in the table below.
Correlation Between 1D, 5D, and 21D Historical Returns
A relatively less risky strategy (though not useful if the correlation is low) is to understand the correlation between short-term and medium-term returns post earnings, find a pair that has the highest correlation, and execute the appropriate trade. For example, if 1D and 5D show the highest correlation, a trader can position themselves “long” for the next 5 days if 1D post-earnings return is positive. Here is some correlation data based on 5-year and 3-year (more recent) history. Note that the correlation 1D_5D refers to the correlation between 1D post-earnings returns and subsequent 5D returns.

BBWI Correlation Between 1D, 5D and 21D Historical Returns
Is There Any Correlation With Peer Earnings?
Sometimes, peer performance can have influence on post-earnings stock reaction. In fact, the pricing-in might begin before the earnings are announced. Here is some historical data on the past post-earnings performance of Bath & Body Works stock compared with the stock performance of peers that reported earnings just before Bath & Body Works. For fair comparison, peer stock returns also represent post-earnings one-day (1D) returns.

Learn more about Trefis RV strategy that has outperformed its all-cap stocks benchmark (combination of all 3, the S&P 500, S&P mid-cap, and Russell 2000), to produce strong returns for investors.
Invest with Trefis Market-Beating Portfolios
See all Trefis Price Estimates
The views and opinions expressed herein are the views and opinions of the author and do not necessarily reflect those of Nasdaq, Inc.


