
The US stock market is one of the world’s greatest generators of wealth.
Even regular, everyday people can participate in this magnificent machine.
You don’t have to be special in order to tap into the immense power of compounding.
But there’s a price to pay for all of that upside: volatility.
The ups and downs of the market can shake out well-meaning participants unable to deal with the emotional toll of the variances.
This is one big reason why I’m such an ardent fan (and practitioner) of dividend growth investing.
This is a long-term investment strategy involving the buying and holding of shares in world-class enterprises paying out safe, growing dividends to shareholders.
You can find hundreds of examples of these enterprises over on the Dividend Champions, Contenders, and Challengers list – a compilation of US-listed stocks that have raised dividends each year for at least the last five consecutive years.
The dividend growth investing strategy can greatly “dampen” or “smooth” the effects of volatility.
First of all, the strategy tends to funnel investors right into some of the world’s best businesses whose shares tend to be less volatile than average anyway.
Second, and more importantly, when you’re regularly collecting steady and growing dividend income, and when that becomes your focus, the concern over volatility fades away anyway.
You want to put yourself in a position to get your bills paid by passive dividend income, which totally bypasses the stock market and its volatility.
I speak from experience, as I put myself in this position years ago, even being able to retire in my early 30s.
My Early Retirement Blueprint shares the details behind all of that.
By following the dividend growth investing strategy, I built the FIRE Fund.
That’s my real-money portfolio, and it generates enough five-figure passive dividend income for me to live off of.
All that said, we can also use volatility to our advantage by buying stocks after they’ve fallen and developed an attractive valuation.
Price is what you pay, but value is what you get.
An undervalued dividend growth stock should provide a higher yield, greater long-term total return potential, and reduced risk.
This is relative to what the same stock might otherwise provide if it were fairly valued or overvalued.
Price and yield are inversely correlated. All else equal, a lower price will result in a higher yield.
That higher yield correlates to greater long-term total return potential.
This is because total return is simply the total income earned from an investment – capital gain plus investment income – over a period of time.
Prospective investment income is boosted by the higher yield.
But capital gain is also given a possible boost via the “upside” between a lower price paid and higher estimated intrinsic value.
And that’s on top of whatever capital gain would ordinarily come about as a quality company naturally becomes worth more over time.
These dynamics should reduce risk.
Undervaluation introduces a margin of safety.
This is a “buffer” that protects the investor against unforeseen issues that could detrimentally lessen a company’s fair value.
It’s protection against the possible downside.
Using savings to buy undervalued high-quality dividend growth stocks is a terrific way to tapping into the immense power of the stock market and long-term compounding.
Being able to spot undervaluation does, of course, require one to already understand the basics behind the whole concept of valuation.
This is where Lesson 11: Valuation can come in handy.
Written by fellow contributor Dave Van Knapp, it clearly describes valuation using simple terminology and even provides a template you can go off and use all on your own.
With all of this in mind, let’s take a look at a high-quality dividend growth stock that appears to be undervalued right now…
Realty Income Corp. (O)
Realty Income Corp. (O) is a real estate investment trust that primarily leases freestanding, single tenant, triple-net-leased retail properties.
Founded in 1969, it’s now a $52 billion (by market cap) real estate giant that employs approximately 500 people.
Realty Income’s property portfolio of ~15,500 properties is diversified across the US, Puerto Rico, and parts of Western Europe.
The company serves more than 1,600 clients operating across 90+ different industries.
The property portfolio has an occupancy rate of 98.7%.
Almost 80% of the properties are retail by type, while the remainder is mostly industrial.
No one tenant comprises more than 3.3% of annualized contractual rent.
The story of real estate is one of supply and demand.
Supply is finite.
As the old saying about land goes: “They’re not making it anymore.”
This built-in scarcity is reinforced by the fact that actually building out physical real estate infrastructure requires massive investments across expertise, time, and capital.
Yet, demand has almost no ceiling.
Despite great advances in technology, people still live in and interact with the physical world.
We live, go to work, store, and shop in physical buildings, leading to built-in demand for real estate.
Furthermore, the world is growing larger and richer, creating even more demand for all of the various purposes of real estate (such as shelter and commerce) – even as supply remains constrained.
Realty Income capitalizes on this favorable supply-demand setup by erecting profitable properties on valuable tracts of prized land.
The REIT takes things a step further by employing commercial triple-net leases on its properties.
This is a lease agreement on a property in which the tenant agrees to pay all of the expenses of the property, including real estate taxes, building insurance, and maintenance.
This passes on a lot of costs to tenants, minimizing Realty Income’s overhead in the process.
Speaking of tenants, Realty Income has some of the biggest and best ones out there already installed (including the likes of Home Depot and Life Time Fitness).
Realty Income’s properties are largely designed for everyday, repeated purposes (e.g., convenience stores, gyms, pharmacies, etc.), giving the REIT some protection against the threat of e-commerce encroachment.
Buying stock in Realty Income allows a retail investor to become an “instant landlord”, suddenly owning a small share of more than 15,000 commercial properties already financed, leased, and cash flowing.
Becoming a landlord on your own involves scouting, studying comps, lining up financing, leverage, closing, finding tenants, managing property, etc.
And that’s just one property.
Imagine doing that more than 15,000 times!
If you like the idea of collecting monthly “rent checks” without doing any of the heavy lifting yourself, buying stock in Realty Income makes that idea a reality.
Realty Income has been an absolute rock when it comes to consistently generating revenue, profit, and dividend growth for shareholders, which appears set to continue for years to come.
Dividend Growth, Growth Rate, Payout Ratio and Yield
To that point, Realty Income has increased its dividend for 32 consecutive years.
It’s one of only a few REITs that can claim to be a Dividend Aristocrat, showcasing the company’s ability to consistently and resiliently deliver dividends to shareholders.
By the way, it’s not just dividends; Realty Income pays monthly dividends – synthetically mimicking monthly rent checks for shareholders.
This is all right in the company’s official mission: “To invest in people and places to deliver dependable monthly dividends that increase over time.”
The company takes its role so seriously, it trademarked its moniker: The Monthly Dividend Company®.
Realty Income was built to be a monthly dividend machine.
Its 10-year dividend growth rate of 3.6% is not super high, but it does exceed inflation (under normal circumstances), keeping purchasing power intact and moving ahead over time.
Besides, REITs tend to attract investors for the yield and income prospects, not growth.
Regarding this attraction, the stock’s current yield of 5.7% is almost certainly going to be attractive for income-oriented investors.
It blows away what the broader market offers.
This yield is also 90 basis points higher than its own five-year average.
And based on midpoint guidance for this year’s AFFO/share, the payout ratio works out to 75.9% – a reasonable and common type of payout ratio for a REIT.
Since REITs are legally obligated to to pay out at least 90% of taxable income in the form of dividends, rich dividends and elevated payout ratios are common across the entire space (making REITs an easy target for income-seeking investors).
A higher payout ratio is a feature, not a bug, in this case, and I see Realty Income’s dividend as being as safe as it’s ever been.
Realty Income’s reputation precedes itself; the REIT is a faithful monthly dividend payer to the nth degree.
Revenue and Earnings Growth
As faithful as it’s been, though, much of this faithfulness is based on prior data.
However, investors must always be anticipating what may come, as today’s capital is risked for tomorrow’s rewards.
Thus, I’ll now build out a forward-looking growth trajectory for the business, which will be useful when later estimating intrinsic value.
I’ll first show you what the business has done over the last decade in terms of its top-line and bottom-line growth.
I’ll then reveal a professional prognostication for near-term profit growth.
Lining up the proven past with a future forecast in this way should give us a base of information from which to estimate where the business could be going from here.
Realty Income grew its revenue from $1 billion in FY 2015 to $5.3 billion in FY 2024.
That’s a compound annual growth rate of 20.4%.
As great (and surprising) as this top-line growth is, it’s highly misleading.
First, Realty Income has been actively acquisitive over the last decade.
The best example of this is Realty Income’s merger with former competitor VEREIT in 2021 (at an equivalent cost of ~$11 billion), which substantially increased revenue all in one shot.
The 2023 acquisition of Spirit Realty Capital in all-stock deal worth $9.3 billion is another case in point.
Second, there’s the dilution matter to contend with.
REITs usually fund growth via debt and equity issuances (because a lot of cash flow goes out the door in the form of dividends, limiting internal reinvestment/growth abilities).
With a REIT, it’s imperative to look at profit growth on a per-share basis (which includes the impact of dilution).
And when assessing profit for a REIT, we want to do that using funds from operations (or adjusted funds from operations) rather than normal earnings.
FFO is a measure of cash generated by a REIT, which adds depreciation and amortization expenses back to earnings (giving us a more realistic picture of profit/cash flow for this type of entity).
FFO/share for Realty Income grew from $2.77 to $4.01 over this period, which is a CAGR of 4.2%.
Wow.
We went from 20% growth to 4% growth in a hurry.
This 4.2% figure is really the far more accurate of the two, providing us with a sense of just how fast Realty Income is actually growing.
For anyone familiar with REITs, this type of growth should be unsurprising.
But I also mean that in the best possible way, since Realty Income has just been so incredibly consistent for so incredibly long.
Again, if one is in the market for growth, this stock probably doesn’t make a lot of sense (nor will REITs, in general).
But if steady monthly dividend income is the objective, and one wants some modest growth sprinkled in in order to keep up with inflation, this stock can make a ton of sense.
Looking forward, CFRA currently has no three-year projection for Realty Income’s FFO/share.
Although this is disappointing, CFRA commonly lacks this kind of forecast for REITs.
However, we can still triangulate things pretty nicely.
CFRA does include this nugget: “We forecast FFO of $4.26 in 2025 and $4.55 in 2026, representing 7.2% CAGR. Higher operating expenses may limit 2025 growth following acquisition expansion.”
CFRA’s view “…reflects [Realty Income]’s defensive tenant profile, with 36.3% of annual rent from non-discretionary sectors (grocery, convenience, drug stores, dollar stores, quick service restaurants), positioning it well against potential 2025 consumer headwinds. Tenant balance sheets remain healthy with bad debt at 0.5% of revenue. We view positively [Realty Income]’s expansion into gaming, European markets, and data centers.”
Adding on to that last point, Realty Income has recently diversified away from its legacy triple-net retail CRE footprint.
Although this does drift away from the core competency and add execution risk, it also diversifies the firm into faster-growing areas of CRE with better value and growth metrics.
These new areas of development and investment represent a tiny fraction of the portfolio pie, but the opportunity set for Realty Income from here is large.
Balancing things out, I agree with CFRA and think it’s a positive development and step in the right direction.
Bolstering confidence in Realty Income’s growth trajectory, we can look at more recent results out of the REIT.
For the first nine months of this year, Realty Income’s FFO/share has grown by a YOY rate of 6.4%.
That’s solid, above-trend growth.
I’d be hesitant to lean too much into the high-single-digit growth narrative here, but Realty Income doesn’t need to do that in order to make the stock a good long-term investment.
A near-6% yield backed by LSD-MSD growth checks the right boxes (income and growth) and can get one to a ~10% annualized rate of return (assuming no major changes to the multiples).
As long as Realty Income can continue to fund the monthly dividend and inch forward quarter after quarter, it’s doing what it’s built to do.
If there’s room for some upside surprise here (just in case Realty Income can do something closer to HSD growth), all the better.
In the meantime, it’s a one-foot bar to step over.
For income-oriented dividend growth investors, this sleep-well-at-night monthly payer offers up a great total package.
Financial Position
Moving over to the balance sheet, Realty Income has a good financial position.
The company’s credit ratings are well into investment-grade territory: A3, Moody’s; A-, S&P Global.
Additionally, many of Realty Income’s top tenants have well-capitalized balance sheets and investment-grade credit ratings of their own.
A common measure for a REIT’s financial position is the debt/EBITDA ratio.
Most of the REITs I’ve come across tend to be in a range between 3 and 7 on this ratio.
Realty Income finished last fiscal year with a net debt/pro forma adjusted EBITDAre ratio of 5.4.
That lands roughly in the middle.
Neither terrific nor terrible.
I’m not amazed by Realty Income’s balance sheet (nor am I really impressed by balance sheets across the entire REIT spectrum), but I give this firm the benefit of the doubt.
The company’s management team has consistently shown financial discipline and capital allocation prudence.
Overall, what we have here is a well-run, curated commercial real estate empire.
Combining favorable triple-net leases with a diversified roster of top tenants across varied real estate types is a simple approach that has led to one of the best long-term track records in the entire commercial real estate space.
And with massive scale, deep industry expertise, and long-term contracts locking in tenants, the company does benefit from durable competitive advantages.
Of course, there are risks to consider.
Litigation, regulation, and competition are omnipresent risks in every industry.
Real estate demand is inherently cyclical, and any kind of recession could impact Realty Income’s tenants, which could then impact Realty Income itself.
The capital structure of a REIT relies on external funding for growth (because most of the income is paid out to shareholders in the form of dividends), resulting in debt and equity issuances, which exposes the company to volatile capital markets and interest rates.
Elevated interest rates can hurt the company twice over: Debt becomes more expensive (through higher servicing costs), and equity can also become more expensive (because income-sensitive investors have alternatives, which can reduce demand for and pricing on the stock).
A recession can also hurt the company twice over: Demand for commercial real estate can cool, and equity issuances after a presumed drop in the stock’s price would come at a higher cost.
Realty Income is heavily tied to retail, which exposes the firm to various headwinds in this space (such as the rise of e-commerce, as well as physical retail theft).
The company’s scale is an advantage, but it also introduces concerns regarding the REIT’s size and how the law of large numbers may start to harm growth.
Its size and saturation across retail real estate has also likely led to the pivot toward new types of real estate, but this introduces execution risks.
The company’s growing international footprint is adding geopolitical risks and exposure to currency exchange rates.
Many of these risks are quite general to retail REITs, but Realty Income has shown an ability to properly navigate risks over a very long period of time.
Yet, the stock’s valuation doesn’t appear to give this company and its team enough credit…
Valuation
Based on midpoint guidance for this year’s AFFO/share the forward P/AFFO ratio is 13.2.
That’s somewhat analogous to a P/E ratio on a normal stock (since we don’t use EPS for a REIT), showing just how undemanding the valuation here is.
The P/CF ratio, another common way to quickly evaluate a REIT’s valuation, is sitting at 13.4 (lining up well with the multiple above, which is unsurprising since FFO is a measure of cash flow).
The five-year average P/CF ratio for this stock is 15.8, revealing an opportunistic gap.
And the yield, as noted earlier, is significantly higher than its own recent historical average.
So the stock looks cheap when looking at basic valuation metrics. But how cheap might it be? What would a rational estimate of intrinsic value look like?
I valued shares using a dividend discount model analysis.
I factored in a 10% discount rate and a long-term dividend growth rate of 4%.
This growth rate is very close to the demonstrated dividend growth over the last decade, but it does assume a slight acceleration based on more recent numbers out of Realty Income.
The company is posting up 6%+ FFO/share growth this year, and CFRA is anticipating something closer to 7% over the next couple of years.
That would easily open up the dividend for 4% growth.
I’m not expecting anything herculean here; instead, I’m basically looking for Realty Income to keep doing what it’s been doing.
If anything, as I noted earlier, there’s some room for upside surprise, and I’d argue I’m erring on the side of caution.
The DDM analysis gives me a fair value of $55.91.
The reason I use a dividend discount model analysis is because a business is ultimately equal to the sum of all the future cash flow it can provide.
The DDM analysis is a tailored version of the discounted cash flow model analysis, as it simply substitutes dividends and dividend growth for cash flow and growth.
It then discounts those future dividends back to the present day, to account for the time value of money since a dollar tomorrow is not worth the same amount as a dollar today.
I find it to be a fairly accurate way to value dividend growth stocks.
My viewpoint is that this stock is being priced pretty appropriately by the market, although I am being conservative with my model.
But we’ll now compare that valuation with where two professional stock analysis firms have come out at.
This adds balance, depth, and perspective to our conclusion.
Morningstar, a leading and well-respected stock analysis firm, rates stocks on a 5-star system.
1 star would mean a stock is substantially overvalued; 5 stars would mean a stock is substantially undervalued. 3 stars would indicate roughly fair value.
Morningstar rates O as a 5-star stock, with a fair value estimate of $75.00.
CFRA is another professional analysis firm, and I like to compare my valuation opinion to theirs to see if I’m out of line.
They similarly rate stocks on a 1-5 star scale, with 1 star meaning a stock is a strong sell and 5 stars meaning a stock is a strong buy. 3 stars is a hold.
CFRA rates O as a 3-star “HOLD”, with a 12-month target price of $60.00.
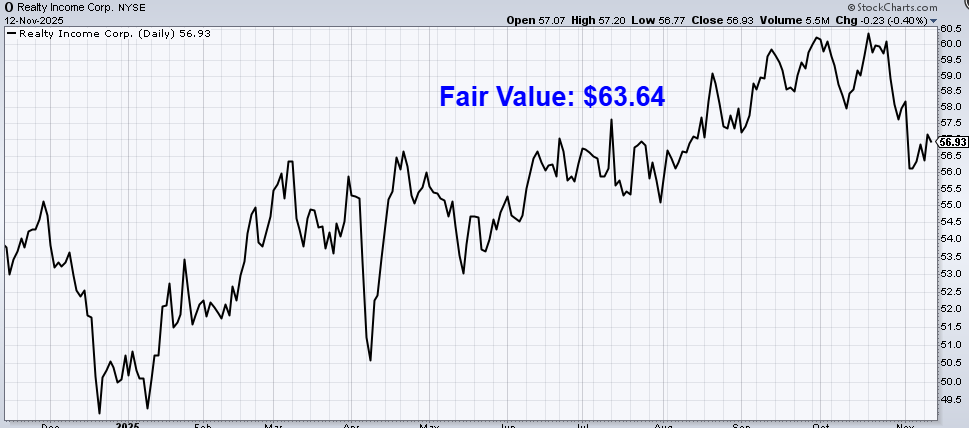
I ended up with the lowest figure, perhaps jibing with my more conservative model. Averaging the three numbers out gives us a final valuation of $63.64, which would indicate the stock is possibly 11% undervalued.
Bottom line: Realty Income Corp. (O) has assembled a high-quality commercial real estate empire. For those who want to synthetically replicate a “monthly rent check” without any of the headaches, Realty Income and its unquestioned loyalty to its monthly dividend is about as good as you’ll find. With a market-smashing yield, inflation-beating dividend growth, a reasonable payout ratio, more than 30 consecutive years of dividend increases, and the potential that shares are 11% undervalued, this might just be one of the best Dividend Aristocrats on the market for long-term dividend growth investors looking for some income juice.
-Jason Fieber
Note from D&I: How safe is O‘s dividend? We ran the stock through Simply Safe Dividends, and as we go to press, its Dividend Safety Score is 80. Dividend Safety Scores range from 0 to 100. A score of 50 is average, 75 or higher is excellent, and 25 or lower is weak. With this in mind, O‘s dividend appears Safe with an unlikely risk of being cut. Learn more about Dividend Safety Scores here.
P.S. If you’d like access to my entire six-figure dividend growth stock portfolio, as well as stock trades I make with my own money, I’ve made all of that available exclusively through Patreon.
Disclosure: I’m long O.


