
The US is heralded for its various freedoms.
Freedom of speech, freedom of press, freedom of religion, etc.
But there’s one freedom that, arguably, matters more than any other, and this freedom isn’t necessarily tied to a country.
The freedom I’m talking about is financial freedom.
There’s no greater freedom than this; financial freedom is true freedom.
And that’s because it allows you to do what you want, when you want.
Priceless.
When it comes to achieving financial freedom, I’d argue (from personal experience) the very best way to do that is through the dividend growth investing strategy.
This long-term investment strategy, which prioritizes buying and holding shares in high-quality businesses paying safe and growing dividends to shareholders, is practically tailored to achieving financial freedom, as it funnels one right into terrific businesses shelling out lots of growing passive income which can be the foundation of one’s financial freedom.
You can find hundreds of businesses that qualify for the strategy by perusing the Dividend Champions, Contenders, and Challengers list.
This is a curated list featuring US-listed stocks that have raised dividends each year for at least the last five consecutive years.
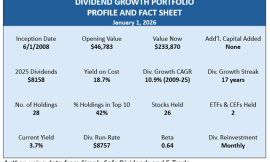
By using the strategy to build the FIRE Fund – my real-life portfolio which generates enough five-figure passive dividend income to live off of – I was able to secure financial freedom for myself and even retire in my early 30s.
My Early Retirement Blueprint details all of that.
Of course, the strategy involves more than just selecting the right businesses to invest in.
There’s also the matter of selecting the right valuations.
Price is just what you pay, but value is ultimately what you get.
An undervalued dividend growth stock should provide a higher yield, greater long-term total return potential, and reduced risk.
This is relative to what the same stock might otherwise provide if it were fairly valued or overvalued.
Price and yield are inversely correlated. All else equal, a lower price will result in a higher yield.
That higher yield correlates to greater long-term total return potential.
This is because total return is simply the total income earned from an investment – capital gain plus investment income – over a period of time.
Prospective investment income is boosted by the higher yield.
But capital gain is also given a possible boost via the “upside” between a lower price paid and higher estimated intrinsic value.
And that’s on top of whatever capital gain would ordinarily come about as a quality company naturally becomes worth more over time.
These dynamics should reduce risk.
Undervaluation introduces a margin of safety.
This is a “buffer” that protects the investor against unforeseen issues that could detrimentally lessen a company’s fair value.
It’s protection against the possible downside.
Using dividend growth investing appropriately by routinely accumulating undervalued high-quality dividend growth stocks can lead to the freedom that matters most: financial freedom.
Now, the preceding discussion on valuation does assume that one already understands what valuation is and how it works.
If you need any brushing up on that, make sure to give Lesson 11: Valuation a read.
Written by fellow contributor Dave Van Knapp, it shares the necessary mechanics of valuation in a very straightforward way, making it much easier to go out and estimate the fair value of just about any dividend growth stock you’ll come across.
With all of this in mind, let’s take a look at a high-quality dividend growth stock that appears to be undervalued right now…
T. Rowe Price Group Inc. (TROW)
T. Rowe Price Group Inc. (TROW) is a US-based global investment management firm.
Founded in 1937, T. Rowe Price is now a $22.5 billion (by market cap) investment house that employs approximately 8,000 people.
With just under $1.8 trillion in assets under management, T. Rowe Price counts itself as one of the largest US-based asset managers.
T. Rowe Price is running one of the very best business models out there.
Large asset managers are structured to win over the long run.
The structural superiority comes down to fees.
T. Rowe Price charges fees to manage assets, and these fees have powerful advantages that are built right in.
First, the fees are naturally tied to, and lifted by, exponential growth.
The company’s various funds are heavily allocated to global equities; as the world’s economic output continues to grow, global equities should continue to compound.
This results in exponential growth of the underlying asset base upon which fees are charged (and, thus, the fees themselves).
Second, the assets T. Rowe Price manages, and fees it collects as a result, are “sticky” once in place.
After assets are committed to a manager, inertia takes over and the path of least resistance becomes to leave the assets alone.
This is a general phenomenon among asset managers, but what makes T. Rowe Price’s assets particularly sticky is the composition/type of these assets.
Roughly two-thirds of the company’s AUM stems from retirement-based accounts, which are very long-term assets often related to employer-sponsored plans.
These accounts cannot shift on a whim.
This strong tilt toward adherent retirement-based assets helps to protect the firm from outflows, even during times of market weakness.
T. Rowe Price has been using this fee-based recipe for success for nearly a century and its entrenchment positions the company for continued growth across its revenue, profit, and dividend over the decades to come.
Dividend Growth, Growth Rate, Payout Ratio and Yield
Already, T. Rowe Price has increased its dividend for 39 consecutive years.
Yep, this is an esteemed Dividend Aristocrat, and it’s well on its way to Dividend King status.
Its 10-year dividend growth rate is 10.9%, which is very solid, although more recent dividend raises have been quite a bit lower than that – lately coming in at a low-single-digit or mid-single-digit mark.
While this slowdown in dividend growth (which I’ll explain more later in the article) is unwelcome, the market has already recognized it and compensated for it by pressuring the stock down and causing the yield to rise to 5%.
That readjustment process is painful for those who bought a while ago and held straight through, but it also may open up a nice opportunity for new buyers who can lock in a market-smashing yield now.
This kind of yield from this kind of stock is almost unheard of.
We are talking about one of the country’s most storied financial institutions, and a Dividend Aristocrat.
To put this 5% yield in perspective, it’s 260 basis points higher than its own five-year average.
This stock has often offered an appealing yield, but 5% is way higher than normal.
The elevated nature of the yield is mainly reflective of the lower growth profile, in my view, and not indicative of a safety/sustainability issue with the dividend.
A payout ratio of 55.4% shows us no problems whatsoever with the company’s ability to keep paying the dividend.
For income-oriented investors, this is painting a pretty picture.
Revenue and Earnings Growth
As pretty as it may be, though, this picture is mainly painted using past data.
However, investors must always be considering what data may unfold over the future, as the capital of today gets risked for the rewards of tomorrow.
As such, I’ll now build out a forward-looking growth trajectory for the business, which will come in handy during the valuation process.
I’ll first show you what the business has done over the last decade in terms of its top-line and bottom-line growth.
And I’ll then reveal a professional prognostication for near-term profit growth.
Amalgamating the proven past with a future forecast in this manner should give us enough confidence to sketch out what the company’s growth path from here could look like.
T. Rowe Price advanced its revenue from $4.2 billion in FY 2015 to $7.1 billion in FY 2024.
That’s a compound annual growth rate of 6%.
This isn’t bad at all, especially considering T. Rowe Price’s size, maturity, and lack of activity around M&A (meaning almost all of this growth is organic).
Meanwhile, earnings per share grew from $4.63 to $9.15 over this period, which is a CAGR of 7.9%.
This is really good, but I would caution that EPS growth has been basically flat since 2020.
Although “flat” is only true if you’re drawing a straight line.
In actuality, there was a huge spike in earnings during the anomalous pandemic, followed by a rapid reversion into reality thereafter – prompted by huge flows into the market from the wider public’s sudden interest in the markets during a rare time in history.
But if you slept through that period and just looked at the starting and ending points, T. Rowe Price cooked at a respectable rate.
A ~15% reduction in the outstanding share count over the last decade, fueled by consistent buybacks, helped to drive excess bottom-line growth.
Looking forward, CFRA forecasts that T. Rowe Price will compound its EPS at an annual rate of 5% over the next three years.
Taking into account both the short-term and long-term results out of T. Rowe Price, along with the industry/secular headwinds the company faces, I think this is a fair expectation.
A mid-single-digit type of growth rate is a reasonable baseline assumption to make.
CFRA is enthusiastic about the firm’s market share and historical better-than-average investment performance across its actively-managed funds.
However, CFRA rightly points out the major elephant in the room: persistent outflows.
The Q3 FY 2025 report showed net client outflows of nearly $8 billion, building on a years-long theme.
While this is better than Q2’s ~$15 billion in net client outflows, billions of dollars walking out the door quarter after quarter is a serious issue and raises questions about the business model.
T. Rowe Price is an active manager built on the success of high-fee mutual funds, but the company’s core products are facing secular decline as younger/newer investors favor low-cost passive funds.
This limits inflows.
At the same time, ongoing baby boomer rollovers are occurring, compounding the company’s problems and leading to steady outflows.
T. Rowe Price seemingly has trouble replacing older customers with newer customers, and rising global asset prices can only do much so keep the ship afloat.
Now, let me be clear, the situation isn’t dire.
The stickiness of asset-based retirement accounts, recent introductions of ETFs (albeit with lower fee structures), and moves into alternative assets (notably through the 2021 acquisition of alternative asset manager Oak Hill Advisors) combine to mitigate the outflows.
But it does appear to me that T. Rowe Price is a bit of a “melting ice cube”.
That said, it’s a very large ice cube, and it’s melting relatively slowly, so this could go on for a long time.
As that plays out, shareholders are getting paid a generous dividend and still seeing modest growth of that dividend.
Plus, T. Rowe Price is not exactly putting up terrible numbers.
In that Q3 FY 2025 report I just noted above, the company printed 8.7% YOY EPS growth.
Moreover, despite the net outflows, that same report showed total AUM up 8.4% YOY (owed to the strength of global markets).
Again, the company has many levers to pull, and the business model (even though T. Rowe Price’s specific formation around active management and mutual funds is not optimal) is structurally favorable.
Putting it all together, I agree with where CFRA is at on this one, which means we could be looking at mid-single-digit EPS and dividend growth over the coming years.
With the 5% starting yield, investors looking for income could do worse than that.
Financial Position
Moving over to the balance sheet, T. Rowe Price has a stellar financial position.
The company has no long-term debt at all.
You can’t get any better than a debt-free balance sheet.
Plus, the company is sitting on roughly $3 billion in cash.
The balance sheet is my favorite part of the whole story.
Profitability is also terrific.
Return on equity has averaged 24.7% over the last five years, while net margin has averaged 31.1%.
Building on the loveliness of the balance sheet, T. Rowe Price is generating high returns on capital and fat margins – hallmarks of a high-quality business.
However, margins have slightly compressed in recent years, pressured by industry trends toward lower fees.
Overall, despite the company’s suboptimal slant toward active management and mutual funds, we’re taking about a debt-free Dividend Aristocrat here.
And with economies of scale, performance-oriented brand value, and switching costs that keep assets “sticky”, the company does benefit from durable competitive advantages.
Of course, there are risks to consider.
Regulation, litigation, and competition are omnipresent risks in every industry.
I view all three of those omnipresent risks as elevated for T. Rowe Price in comparison to a typical business.
T. Rowe Price’s core product lineup is facing secular decline, pressured by industry trends toward lower fees and passive management, leading to persistent outflows.
The very business model lends itself to financial risk and volatility.
There’s economic/cyclicality risk present, as any kind of large-scale downturn in the economy would likely lead to lower asset prices and reduced AUM/fees.
Building on that last point, asset managers face a double whammy during down markets: AUM can drop due to falling asset prices, while outflows can simultaneously increase out of fear.
The size of T. Rowe Price may be a risk unto itself, as it’s difficult to grow AUM meaningfully once trillions of dollars are already being managed.
Being a global company, it faces currency exchange rates and geopolitical risks.
It’s obvious to see a bevy of risks, but T. Rowe Price has been facing many of these risks for many years already.
And with the stock more than 50% lower off of its all-time high, a lot of risk may have already been recognized and priced in…
Valuation
The P/E ratio is now just 11.1.
We’re close to single-digit P/E ratio territory here.
This stock has rarely commanded lofty multiples, but this is still well off of the stock’s own five-year average P/E ratio of 13.5 (which itself isn’t high).
Another way to look at it this kind of stock is via a multiple of book.
The P/B ratio of 2.1 is far lower than its own five-year average of 3.
And the yield, as noted earlier, is significantly higher than its own recent historical average.
So the stock looks cheap when looking at basic valuation metrics. But how cheap might it be? What would a rational estimate of intrinsic value look like?
I valued shares using a dividend discount model analysis.
I factored in a 10% discount rate and a long-term dividend growth rate of 5%.
This strikes me as prudent.
It just about splits the difference between the demonstrated 10-year dividend growth rate and more recent dividend growth levels.
It’s also precisely in line with that near-term forecast for EPS growth.
With the payout ratio being where it’s at, and with the balance sheet sporting no debt, there’s no clear reason why T. Rowe Price can’t (or won’t) grow the dividend roughly in line with EPS.
Investors waiting for something closer to the heyday of T. Rowe Price’s large dividend raises will likely find themselves disappointed, but those coming into the stock with reasonable expectations around growth and an appreciation for a 5% yield will likely find themselves pleased.
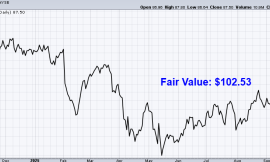
The DDM analysis gives me a fair value of $106.68.
The reason I use a dividend discount model analysis is because a business is ultimately equal to the sum of all the future cash flow it can provide.
The DDM analysis is a tailored version of the discounted cash flow model analysis, as it simply substitutes dividends and dividend growth for cash flow and growth.
It then discounts those future dividends back to the present day, to account for the time value of money since a dollar tomorrow is not worth the same amount as a dollar today.
I find it to be a fairly accurate way to value dividend growth stocks.
I see some very minor undervaluation on this one.
But we’ll now compare that valuation with where two professional stock analysis firms have come out at.
This adds balance, depth, and perspective to our conclusion.
Morningstar, a leading and well-respected stock analysis firm, rates stocks on a 5-star system.
1 star would mean a stock is substantially overvalued; 5 stars would mean a stock is substantially undervalued. 3 stars would indicate roughly fair value.
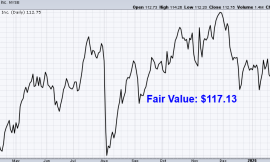
Morningstar rates TROW as a 3-star stock, with a fair value estimate of $113.00.
CFRA is another professional analysis firm, and I like to compare my valuation opinion to theirs to see if I’m out of line.
They similarly rate stocks on a 1-5 star scale, with 1 star meaning a stock is a strong sell and 5 stars meaning a stock is a strong buy. 3 stars is a hold.
CFRA rates TROW as a 3-star “HOLD”, with a 12-month target price of $110.00.
My number came out light, but we’re all in the same ballpark here. Averaging the three numbers out gives us a final valuation of $108.89, which would indicate the stock is possibly 8% undervalued.
Bottom line: T. Rowe Price Group Inc. (TROW) is a storied financial institution managing nearly $2 trillion and benefiting from structural advantages within the business model. Despite persistent outflows, it has many levers to pull and ways to win. With a market-smashing yield, a sustainable payout ratio, double-digit dividend growth, nearly 40 consecutive years of dividend increases, and the potential that shares are 8% undervalued, income-oriented dividend growth investors should consider investing in this debt-free Dividend Aristocrat.
-Jason Fieber
Note from D&I: How safe is TROW‘s dividend? We ran the stock through Simply Safe Dividends, and as we go to press, its Dividend Safety Score is 80. Dividend Safety Scores range from 0 to 100. A score of 50 is average, 75 or higher is excellent, and 25 or lower is weak. With this in mind, TROW‘s dividend appears Safe with an unlikely risk of being cut. Learn more about Dividend Safety Scores here.
P.S. If you’d like access to my entire six-figure dividend growth stock portfolio, as well as stock trades I make with my own money, I’ve made all of that available exclusively through Patreon.
Disclosure: I have no position in TROW.