

Akamai (NASDAQ: AKAM) is scheduled to release its fiscal first-quarter earnings on Thursday, May 8, 2025, with analysts projecting earnings of $1.57 per share on $1.01 billion in revenue. This would represent a 4% year-over-year decline in adjusted earnings and a 2% increase in sales compared to the prior year’s figures of $1.64 per share and $987 million in revenue. Historically, AKAM stock has shown a tendency to underperform following earnings announcements, having declined 56% of the time with a median one-day drop of 10.1% and a maximum observed decline of 22%.
The company is demonstrating resilience and adaptability by effectively leveraging growth in its cloud and security solutions segments to counterbalance the decline in its traditional delivery business. With a current market capitalization of $12 billion, the company reported $4.0 billion in revenue over the past twelve months. Its operating profit stood at $533 million and net income at $505 million during this period.
For event-driven traders, historical patterns may offer an edge, whether by positioning ahead of earnings or reacting to post-release moves. That said, if you seek upside with lower volatility than from individual stocks, the Trefis High Quality portfolio presents an alternative, having outperformed the S&P 500 and generated returns exceeding 91% since its inception. See earnings reaction history of all stocks.

Photo by TheDigitalArtist on Pixabay
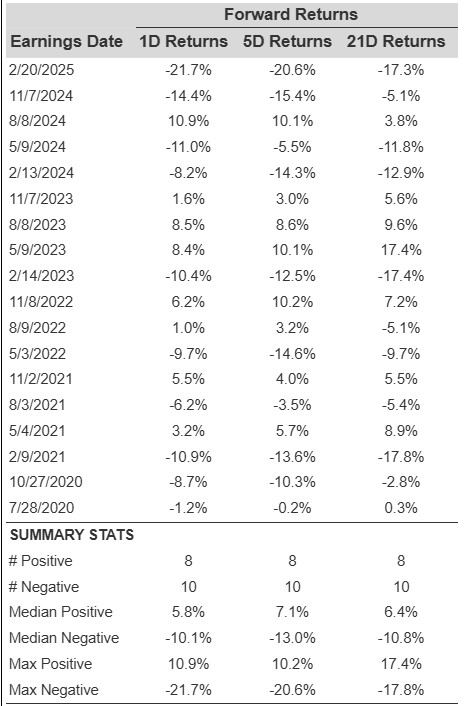
Akamai’s Historical Odds Of Positive Post-Earnings Return
Some observations on one-day (1D) post-earnings returns:
- There are 18 earnings data points recorded over the last five years, with 8 positive and 10 negative one-day (1D) returns observed. In summary, positive 1D returns were seen about 44% of the time.
- Notably, this percentage increases to 55% if we consider data for the last 3 years instead of 5.
- Median of the 8 positive returns = 5.8%, and median of the 10 negative returns = -10%
Additional data for observed 5-Day (5D), and 21-Day (21D) returns post earnings are summarized along with the statistics in the table below.
Correlation Between 1D, 5D, and 21D Historical Returns
A relatively less risky strategy (though not useful if the correlation is low) is to understand the correlation between short-term and medium-term returns post earnings, find a pair that has the highest correlation, and execute the appropriate trade. For example, if 1D and 5D show the highest correlation, a trader can position themselves “long” for the next 5 days if 1D post-earnings return is positive. Here is some correlation data based on 5-year and 3-year (more recent) history. Note that the correlation 1D_5D refers to the correlation between 1D post-earnings returns and subsequent 5D returns.
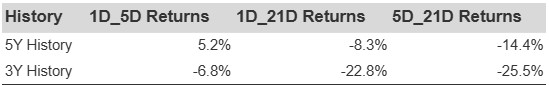
AKAM Correlation Between 1D, 5D and 21D Historical Returns
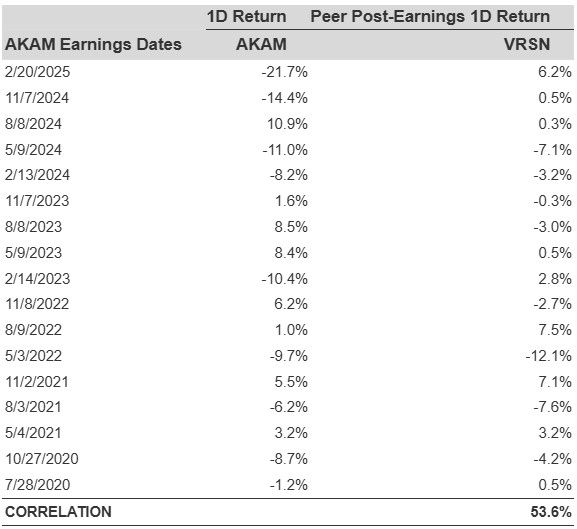
Is There Any Correlation With Peer Earnings?
Sometimes, peer performance can have influence on post-earnings stock reaction. In fact, the pricing-in might begin before the earnings are announced. Here is some historical data on the past post-earnings performance of Akamai Technologies stock compared with the stock performance of peers that reported earnings just before Akamai Technologies. For fair comparison, peer stock returns also represent post-earnings one-day (1D) returns.
Learn more about Trefis RV strategy that has outperformed its all-cap stocks benchmark (combination of all 3, the S&P 500, S&P mid-cap, and Russell 2000), to produce strong returns for investors.
Invest with Trefis Market-Beating Portfolios
See all Trefis Price Estimates
The views and opinions expressed herein are the views and opinions of the author and do not necessarily reflect those of Nasdaq, Inc.


